
The Average Intra-Year Market Drop Is About 14%. Is Your Plan Built for One?

Key Takeaways
- From 1950 through 2025, the S&P 500's largest drop within a calendar year averaged 13.6%, according to the chart below.
- The recent decline of about 6%, measured from the October 6 record close to the November 5 close, was smaller than that yearly average.
- In most of those years the index still ended the calendar year with a positive total return. In some years it did not, and a few ended with large losses.
- A written plan made before a decline is designed to keep volatility from making your decisions for you. It does not remove the risk of loss.
A 6% drop feels dramatic when you check your account every day. Next to 75 years of data, it looks ordinary.
Quick answer: Since 1950, the S&P 500 has fallen an average of 13.6% from a peak to a low inside a calendar year. A 6% decline is smaller than that average. Declines are part of how stock markets have behaved, and no plan can prevent them. A plan can decide in advance how you respond.
In this guide, you'll see:
- What the data shows about drops within a year, and about how those years ended
- How the recent decline compares with the long-term average
- Why one decline does not always signal a change in the economy
- Four questions to answer before the next decline arrives
- How a Retirement War Chest is designed to fund your income through a decline
Table of Contents
What 75 Years of Data Shows
The chart below lists two numbers for every year from 1950 through 2025: the largest drop in the S&P 500 from a peak to a low inside that year, and the year's total return. A drop from a peak to a low is called a drawdown. The chart also shows 2026, which is a partial year through November 6. Drawdowns use closing prices and do not include intraday moves or dividends.
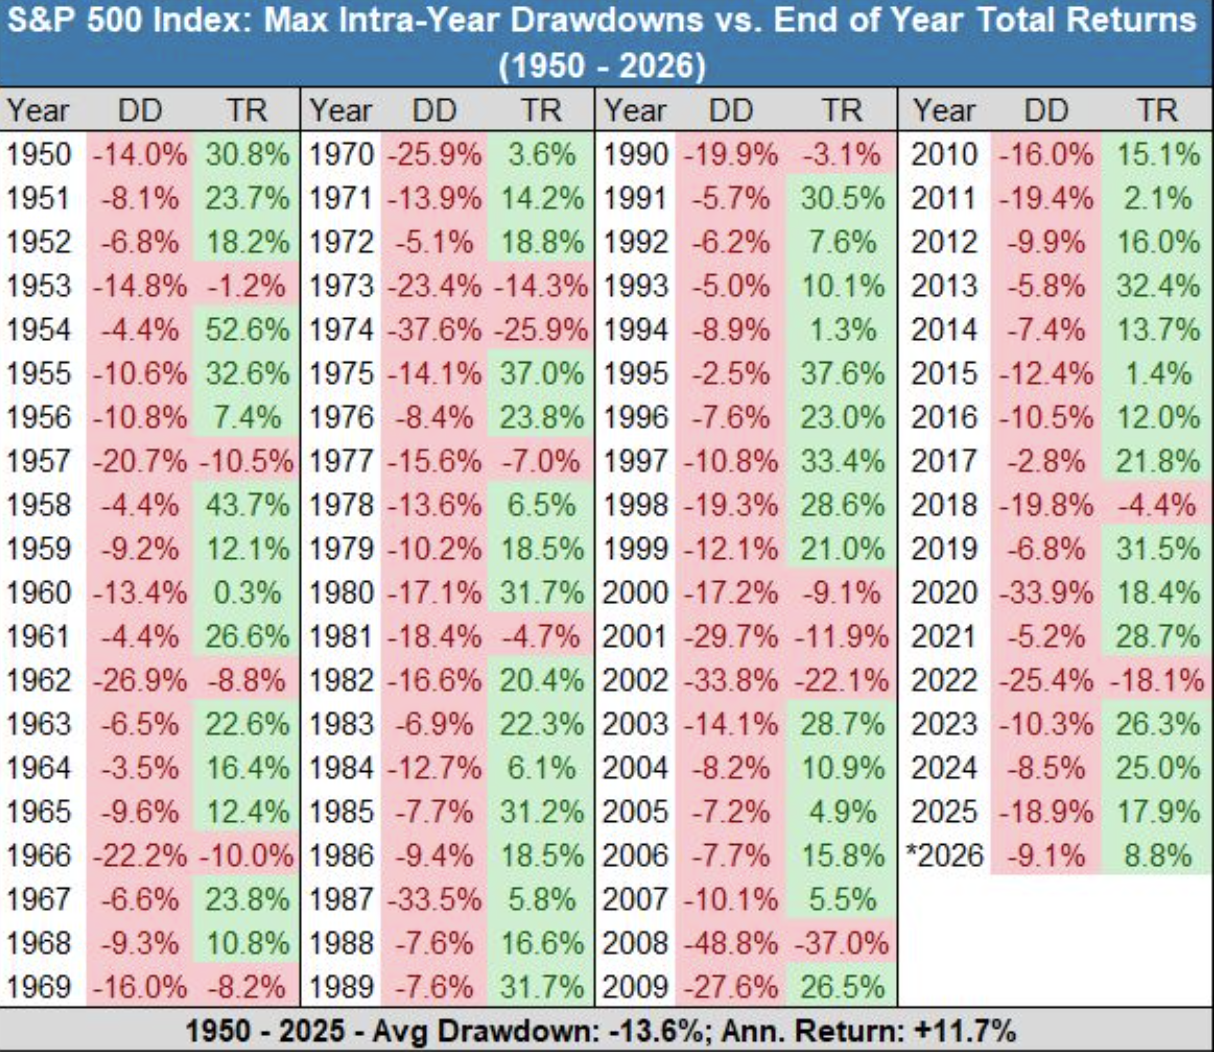
S&P 500 Index: maximum intra-year drawdowns (DD) and calendar-year total returns (TR), 1950 to 2026. Drawdowns use closing prices as of November 6, 2026, and do not include intraday moves or dividends. 2026 is a partial year. You cannot invest in an index directly.
Across those 76 years, the average largest drop was 13.6%. Drops of that size are common in the data. They are not unusual events.
The same chart shows that most years ended with a positive total return despite the drop. Not every year did. Some years ended with large losses, including 1974 (down 25.9%), 2002 (down 22.1%), 2008 (down 37.0%) and 2022 (down 18.1%).
Important: Past performance does not predict future results. The chart describes an index, not any MOKAN Wealth client account, and it does not guarantee that a decline will be followed by a recovery or that a recovery will arrive on any schedule.
How the Recent Decline Compares
The S&P 500 set a record close of 7,818.93 on October 6, 2026. It fell 4.36% on November 5, its worst day since April 2025, and closed at 7,353.73. That put it about 6% below the record. It has recovered part of that decline since.
| Measure | Decline | Note |
|---|---|---|
| October 6 record close to November 5 close | 5.95% | Includes the 4.36% one-day drop on November 5 |
| October 6 record close to November 12 close | 2.90% | Calculated from closing levels; the index recovered part of the decline |
| Average largest drop within a year, 1950 to 2025 | 13.6% | From the chart above |
Sources: Morningstar, Dow Jones Data Talk, November 5, 2026; Yahoo Finance, S&P 500 historical data. Closing levels as of November 12, 2026. Like the chart, these figures use closing prices and do not include intraday moves or dividends.
A decline of this size is smaller than the long-term yearly average. It can still feel large, and it can still be followed by more decline. The data describes what has been common. It does not say what comes next.
Why One Decline Does Not Define a Market
Some declines reflect market mechanics more than a change in the economy. A small number of very large companies make up a large share of the S&P 500. When one of them falls, the index can fall with it, even when little has changed for most businesses.
That does not mean every decline is mechanical. In the moment, it is hard to tell a mechanical decline from the start of something larger. That uncertainty is the reason to decide your response ahead of time.
Why a Decline Looks Bigger Now
Your accounts and the news are on your phone and your television all day. Each small decline is in front of you as it happens.
The size of the decline did not change. How often you see it did.
Decide ahead of time how you will behave in a drawdown, so volatility does not make the decision for you.
Decide Before the Decline
A decision made during a decline can be made with less information and more pressure. Answer these four questions while the market is calm, and write the answers down:
- Which accounts pay for your spending over the next few years? Knowing this shows how much of your income depends on selling during a decline.
- What will you do if the market falls 10%? 20%? Also write down what you will not do.
- Who do you call before you sell anything? A call before a trade gives you a second view.
- How do taxes change the answer? Sales in a taxable account can create capital gains, and withdrawals from pre-tax accounts such as a 401(k) or IRA are taxed as income. The account you sell from matters.
Trade-offs: Staying invested through a decline means accepting that losses can deepen before they recover, and that recovery has no guaranteed timeline. Selling can lock in a loss and may mean missing a rebound. A plan does not remove either risk. It decides in advance how much of each you accept.
If you are within 10 years of retirement or already drawing income, the order of returns matters as much as the average. The article on sequence of returns risk explains why.
Build a Retirement War Chest
The first question above asks which accounts pay for your spending. A Retirement War Chest is one way to answer it. It is built in four steps.
01. The Portfolio Serves the Plan
Your portfolio does not start as a model that your life gets fit around. Your income need, your tax situation, and your retirement timeline come first, and your portfolio follows.
02. Plan for a Bad Decade
Your Retirement War Chest is a dedicated reserve of four to eight years of portfolio income, held in laddered short-term U.S. Treasuries. It is designed to fund your lifestyle when markets pull back and to give your growth investments more time to recover, which may reduce the need to sell at a low point.
03. Know the Return Goal
Your portfolio is not built to chase the highest possible return. It is built around the minimum long-term return your portfolio needs to keep your plan on track. The aim is enough growth to support your income plan and enough stability to help you get through a difficult stretch.
04. Put the Rest to Work
Once your War Chest is funded, the remaining portfolio focuses on long-term growth, with U.S. stocks as the primary emphasis. With 20 to 30 years of retirement possible, your plan may need long-term growth to support your income.
Trade-offs: Money held in short-term Treasuries is not invested for growth. It may earn less than stocks and may not keep pace with inflation. Recovery of your growth investments is not guaranteed, and no reserve removes market risk. Emphasizing U.S. stocks also concentrates risk in one market. The right size for a War Chest depends on your income need, your taxes and your timeline, and it may not suit every household.
Your Plan
Data helps put a decline in perspective. A plan is what gives you a way to stay patient when things get uncomfortable.
A plan is designed to connect your income needs, your taxes and your timeline, so a falling balance is one input and not the only one. Patience is not a guarantee of any outcome. It is a way to keep your decisions tied to your plan instead of the day's headline.
If you want to see how a 10% or 20% decline could affect your income and your taxes, start with a Retirement Fit Meeting. Bring your questions and compare the answers with anyone else you are considering. You can start here.
This content is for educational purposes only and is not investment, tax, or legal advice.